Autumnal Colors
A look at trees, colormaps, and chroma.js.
The fall has always been my favorite season, and according to Google results and a totally scientific poll on Goodreads.com, people agree. It makes sense: the cooler days provide a welcome respite from increasingly hot summer temperatures, along with excuses to drink cider, eat pumpkin pie, and wear sweaters.
One of the best things about autumn is that it brings with it a brilliant set of colors as trees begin to shed their leaves for the winter. This year I’ve found myself paying more attention to nature’s colors than usual. Having spent the summer designing a system for NASA that made heavy use of custom color scales, I’ve got colors on my mind.
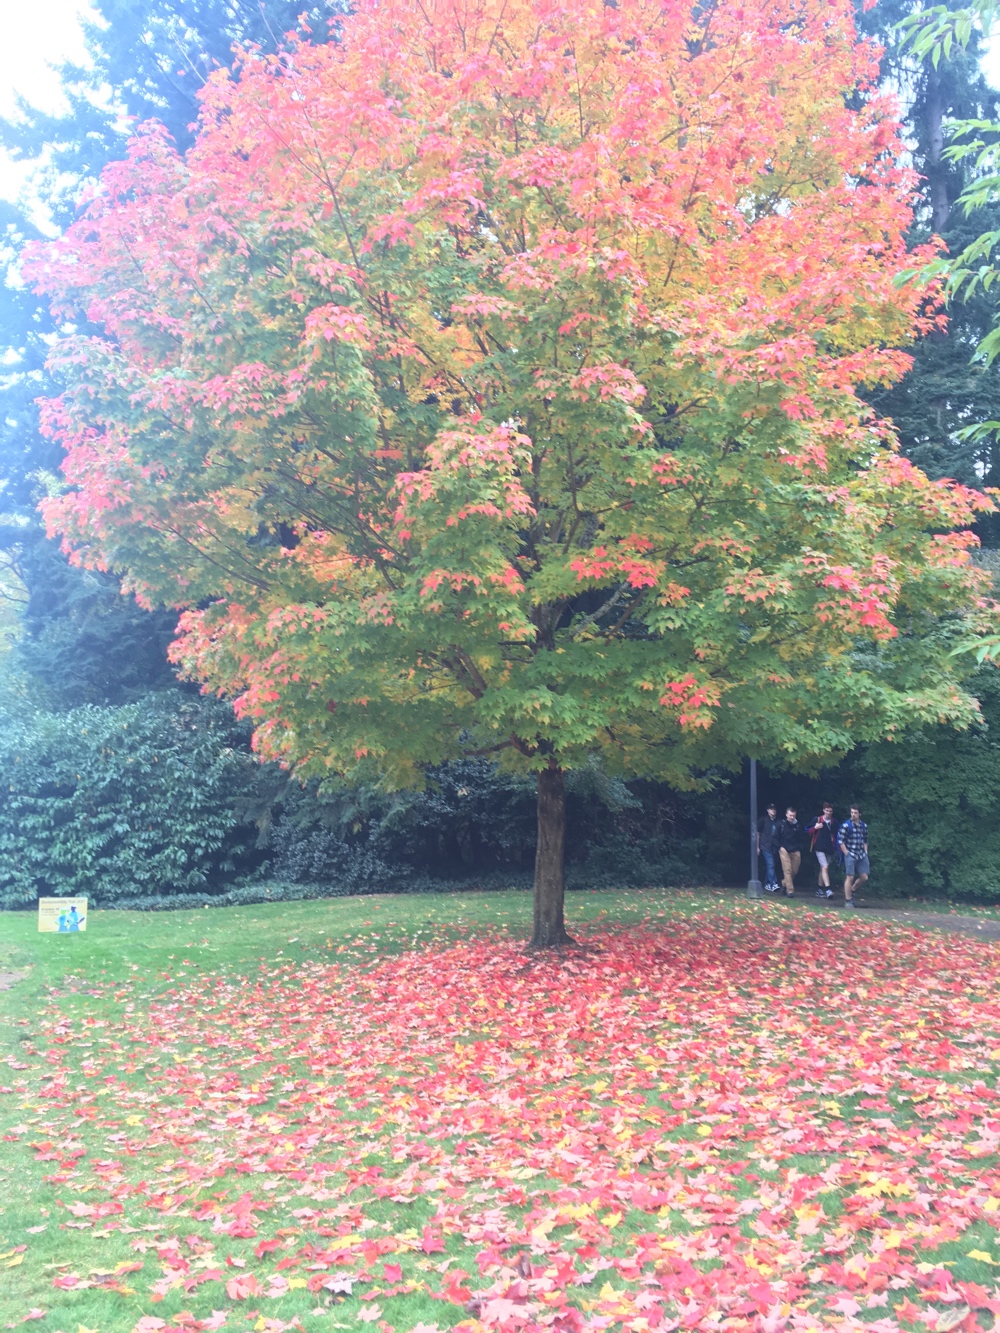 Colors from this image were used to generate the first colormap.
I took pictures of several particularly striking trees around Seattle and the University of Washington campus, hoping to use them to create a fall-inspired palette. Here are three colors that I pulled from one picture, taken from characteristic green, yellow, and red colored leaves:

The colors look nice on their own, but I really wanted to see what it would look like if they were used to generate a colormap; the multicolored trees struck me as a kind of natural gradient.
I used Gregor Aisch’s chroma.js to create custom color scales based on the palette above. The following JavaScript code will create a scale between the three colors, using one of several different color modes.
// Green, yellow, and red colors
const colors = [‘#577C5B’, ‘#FFE298’, ‘#E26783’];

// The mode can be rgb, lab, hsl, lch
const mode = ‘rgb’

// Create the color scale
const scale = chroma.scale(colors).mode(mode);
Disclaimer: People have spent a lot of time and energy developing colormaps that are perceptually effective. In almost all real-world cases you’ll want to use one of those.
The resulting scales look slightly different, depending on the mode used.
The “hue saturation lightness” (HSL) mode stands out as taking a different path through the color space. Color models are a deep and interesting topic that I won’t begin to delve into here.
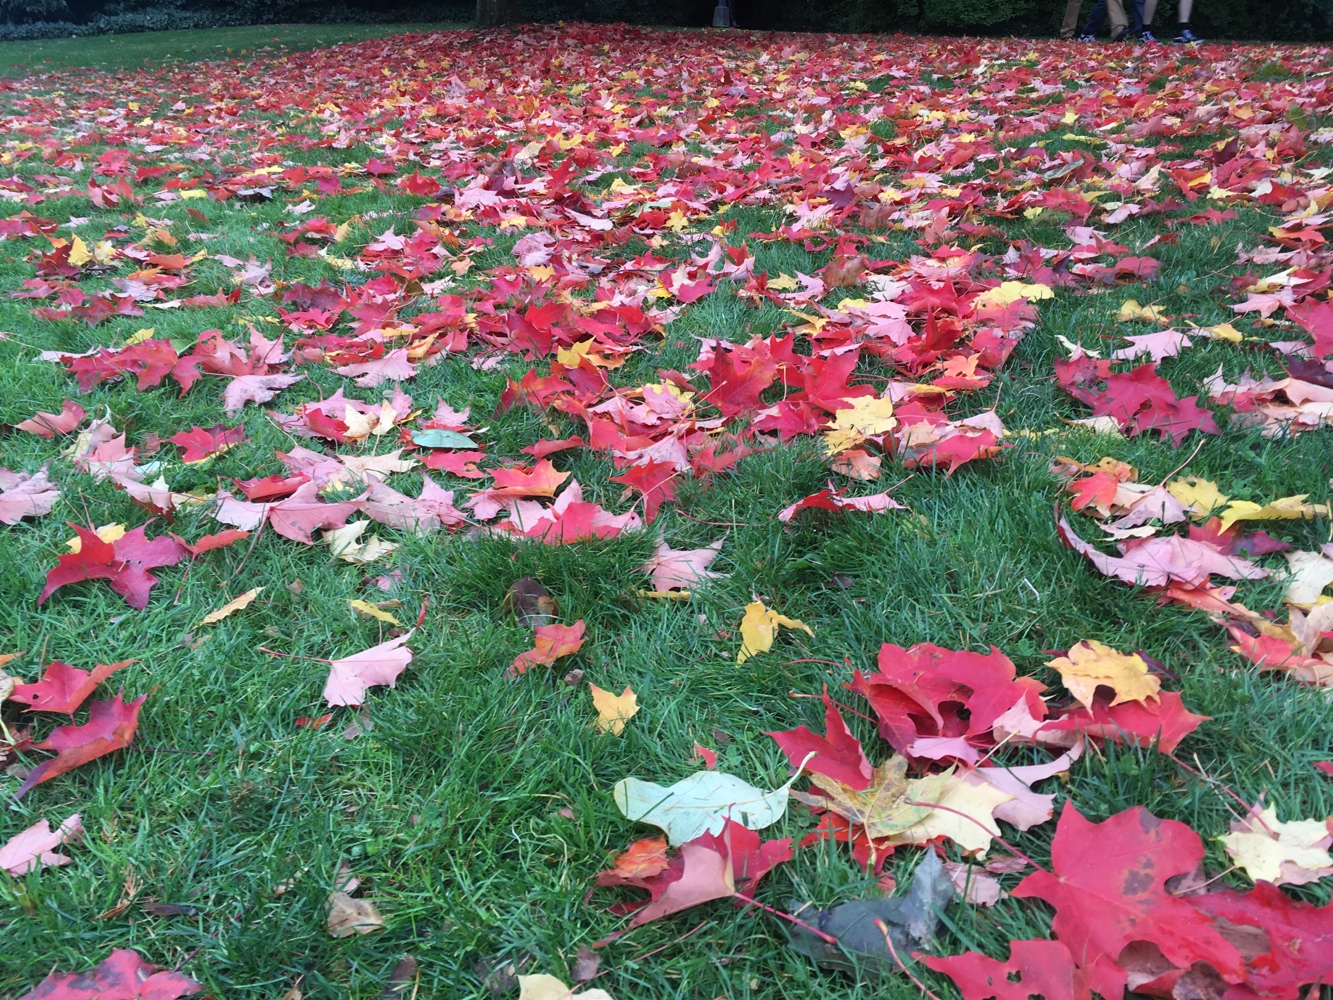 These are extra bright leaves.
These maps were interesting to see, but overall are a little dark, and don’t capture the excitement of the leaves. To make a second, lighter palette, I turned to another picture, this time of leaves on the ground.
Here are the colors I chose from the second image:

Using the same JavaScript code from above (just swapping in the new colorcodes), I generated a new set of colormaps.
This set turned out a bit nicer, I particularly like the LCH mode. The tool below lets you draw by changing parameters of the color scale.
Choose scale:
Choose mode:
Opacity:
Radius:
Points to draw:
Points drawn: 0
This post was created using Idyll, a markup language I’m developing to make it easier to author interactive documents. To learn more about that project visit http://idyll-lang.org/.
Hide