Scaffolding Interactives
Using Idyll to rapidly create interactive narratives, a walkthrough.
Idyll is an open source software project that I work on at the University of Washington Interactive Data Lab. It can be used to help quickly structure, write, and deploy interactive posts like this one.
This post is meant to showcase recent updates to the way that scroll and step functionality is defined. This page is built from a single Idyll markup file, with no external JavaScript or CSS.
Narrative Structures
In this post we cover two types of narrative structures: steppers, and scrollers. As we’ll see, although these layouts are visually distinct, Idyll provides a similar declarative specification for each. Both may be further parameterized and customized to support a range of design output.
Steppers
A Stepper can be thought of as an abstract version of a slideshow. There are controls that allow the
user to navigate through a series of steps. A persistent graphic may also provided in order to create
visualizations with object constancy.
For example, one could use the Stepper component to create a slideshow with
captions for each image.
That is created with the following markup:
[var name:"stepperIndex" value:0 /]
[Stepper currentStep:stepperIndex]
[Graphic]
[img src:`"static/images/examples/" + stepperIndex + ".png"` /]
[/Graphic]
[Step]
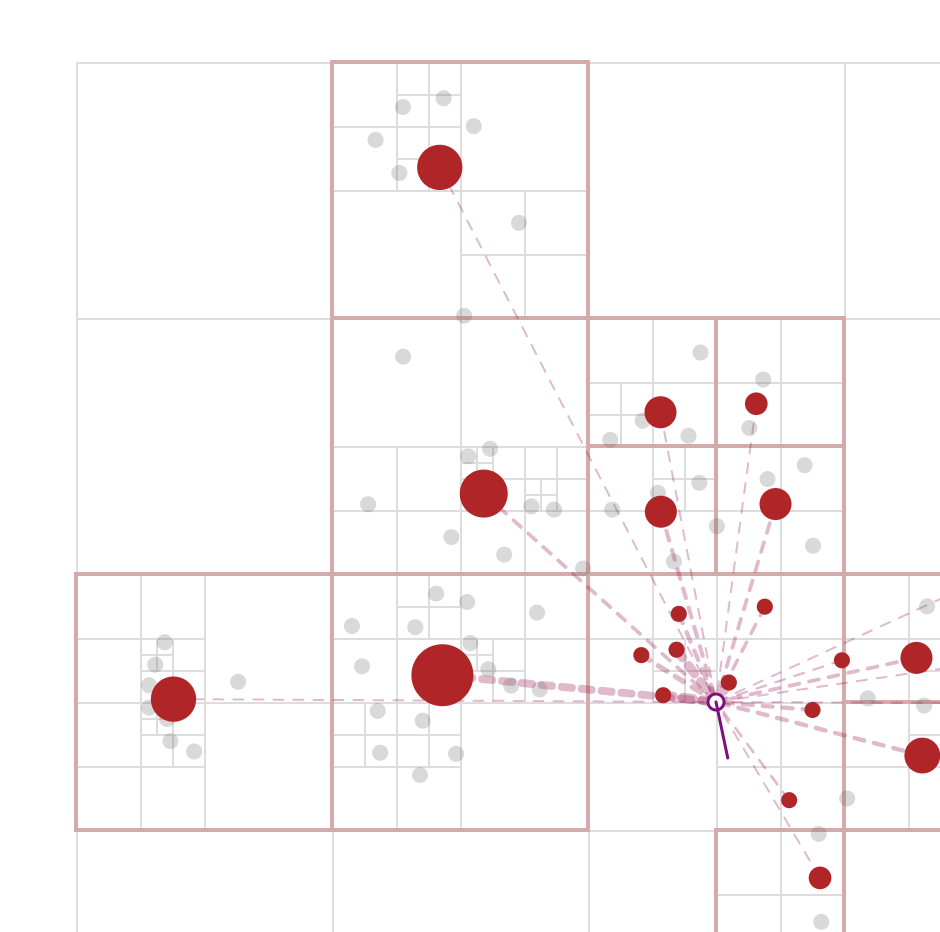
[The Barnes-Hut Approximation: Efficient computation of N-body forces](https://idyll-lang.org/gallery/the-barnes-hut-approximation)
[/Step]
[Step]
[Kernel Density Estimation: An Interactive Explanation of the Statistical Technique](https://idyll-lang.org/gallery/kernel-density-estimation)
[/Step]
[Step]
[The Etymology of Trig Functions](https://idyll-lang.org/gallery/the-etymology-of-trig-functions)
[/Step]
[StepperControl /]
[/Stepper]In this example, a variable named stepperIndex is bound to the
currentStep property of the stepper, causing it to automatically
be updated when the controls are pressed. This in turn causes
the image source url to update. The Graphic component isn’t limited to displaying static images.
Any Idyll component may be used
or you can include your own custom D3 or React component.
The functionality of the stepper can be extended, for example
by adding an onClick handler to the Graphic component to
add simple click-through functionality. The size can be modified
via the fullWidth parameter, letting you create feature-sized
containers. Here I generate some fake data and
pass it as a property to the built-in Chart component inside of a full width Stepper. Click on the chart below to continue.
Hey, neat, here’s some data!
Here’s the code to generate the example above.
[var name:"clickIndex" value:0 /]
[var name:"clickData" value:`[0.5, 0.3, 1.2, 0.4, 5, 4, 2, 0.4]` /]

[Stepper fullWidth:true currentStep:clickIndex]
  [Graphic
    onClick:`clickIndex = (clickIndex + 1) % clickData.length`
    style:`{background: 'white', cursor: 'pointer'}`]

    [Chart
      type:`"line"`
      data:`[0, 1].concat(clickData.slice(0, clickIndex))`
      animate:`{ duration: 500 }` /]

  [/Graphic]

  [Step]## Hey, neat, here's some data![/Step]
  [Step]## Hey, neat, here's some data! ...   [/Step]
  [Step]## Hey, neat, here's some data! ...  What's that more data?![/Step]
  [Step]## Hmm...[/Step]
  [Step]## Hmm... Too much data.[/Step]
  [Step]## Stop.[/Step]
  [Step]## Stop. that.[/Step]
  [Step]## Stop. that. data[/Step]

[/Stepper]
Notice that I removed the default stepper controls in the code above and replaced it with
a custom click handler on the Graphic.
You can use Idyll’s dataset syntax to quickly import your own data JSON or CSV files. And, while, the built in chart component is adequate for examples, you might need a more powerful tool. In that case you might look to the Idyll Vega-Lite component.
Scrollers
The Scroller component can be used to reproduce the experience above
using scroll events rather than clicks.
Scroll through, and then notice how similar the code is to the Stepper
example above.
Hey, neat, here’s some data!
...
... What’s that more data?!
Hmm...
Too much data.
Stop.
that.
data
Code for the above:
[Scroller currentStep:scrollerIndex]
  [Graphic style:`{padding: 50}`]
      [Chart type:`"line"` data:`scrollerChartData.slice(0, scrollerIndex + 2)` /]
  [/Graphic]

  [Step]## Hey, neat, here's some data![/Step]
  [Step]## ...   [/Step]
  [Step]## ...  What's that more data?![/Step]
  [Step]## Hmm...[/Step]
  [Step]## Too much data.[/Step]
  [Step]## Stop.[/Step]
  [Step]## that.[/Step]
  [Step]## data[/Step]

[/Scroller]
The specifications for each are similar enough that this may help with rapidly testing designs across the different modalities.
These components work with all of the various Idyll themes and layouts.
End Notes
To get started using Idyll, head to the docs, or read this interactive overview of the project. Here are links to more examples and an in-browser Idyll editor.
If you want to support the project consider buying a sticker, or tackling one of the issues tagged as help wanted on GitHub.